DO you have unstructured, messy data? Could your reports to be more useful? Can your data quality be improved? Are you monitoring the right indicators?
AT AIMDATA, WE LOVE THESE QUESTIONS. And we love finding answers and making sense of complex data. We are experts in global and regional risk, socioeconomic and geopolitical analysis. Make AIMDATA your trusted partner for all your data needs.
ANALYSE DATA
Know what’s in your data. Structure, process visualise and analyse your data. Make it easy for anyone to use and analyse. Data cleaning and visualisation services also available.
IMPROVE REPORTS
Get real value out of your data with custom-made reports. Review of information and reporting processes to optimise the flow of information in your company.
ACT ON
INTELLIGENCE
Interpret and visualise your data to inform and improve decision making. Find sustainable strategic solutions to your problems and crises.
About us
We’re experts in multidimensional problems and have handled data from almost every sector, including Health, Education, Food, Water and Sanitation, Construction, Finance and Logistics, in all types of contexts, including complex emergencies.
We’re resilient and adaptable and are glad to bring that energy to your company with the following services: Data Cleaning, Visualisation and Analysis, Strategy and Actionable Intelligence, Reporting Systems and Data Quality, Quality Assurance, and Knowledge Management and Capacity Building.
A few things we’re great at
Improve information flows
Like money, data and information are resources that need to flow for your company to thrive. Do your staff and management have enough information to make informed decisions? We offer training in R, Tableau and PowerBI as well as general data analysis.
STREAMLINED reporting
Is there a mismatch between the information you need and what is being reported? Do you regularly review report templates, procedures and KPIs? Let us undertake a deep clean of your reporting processes and automate as much of it as we can.
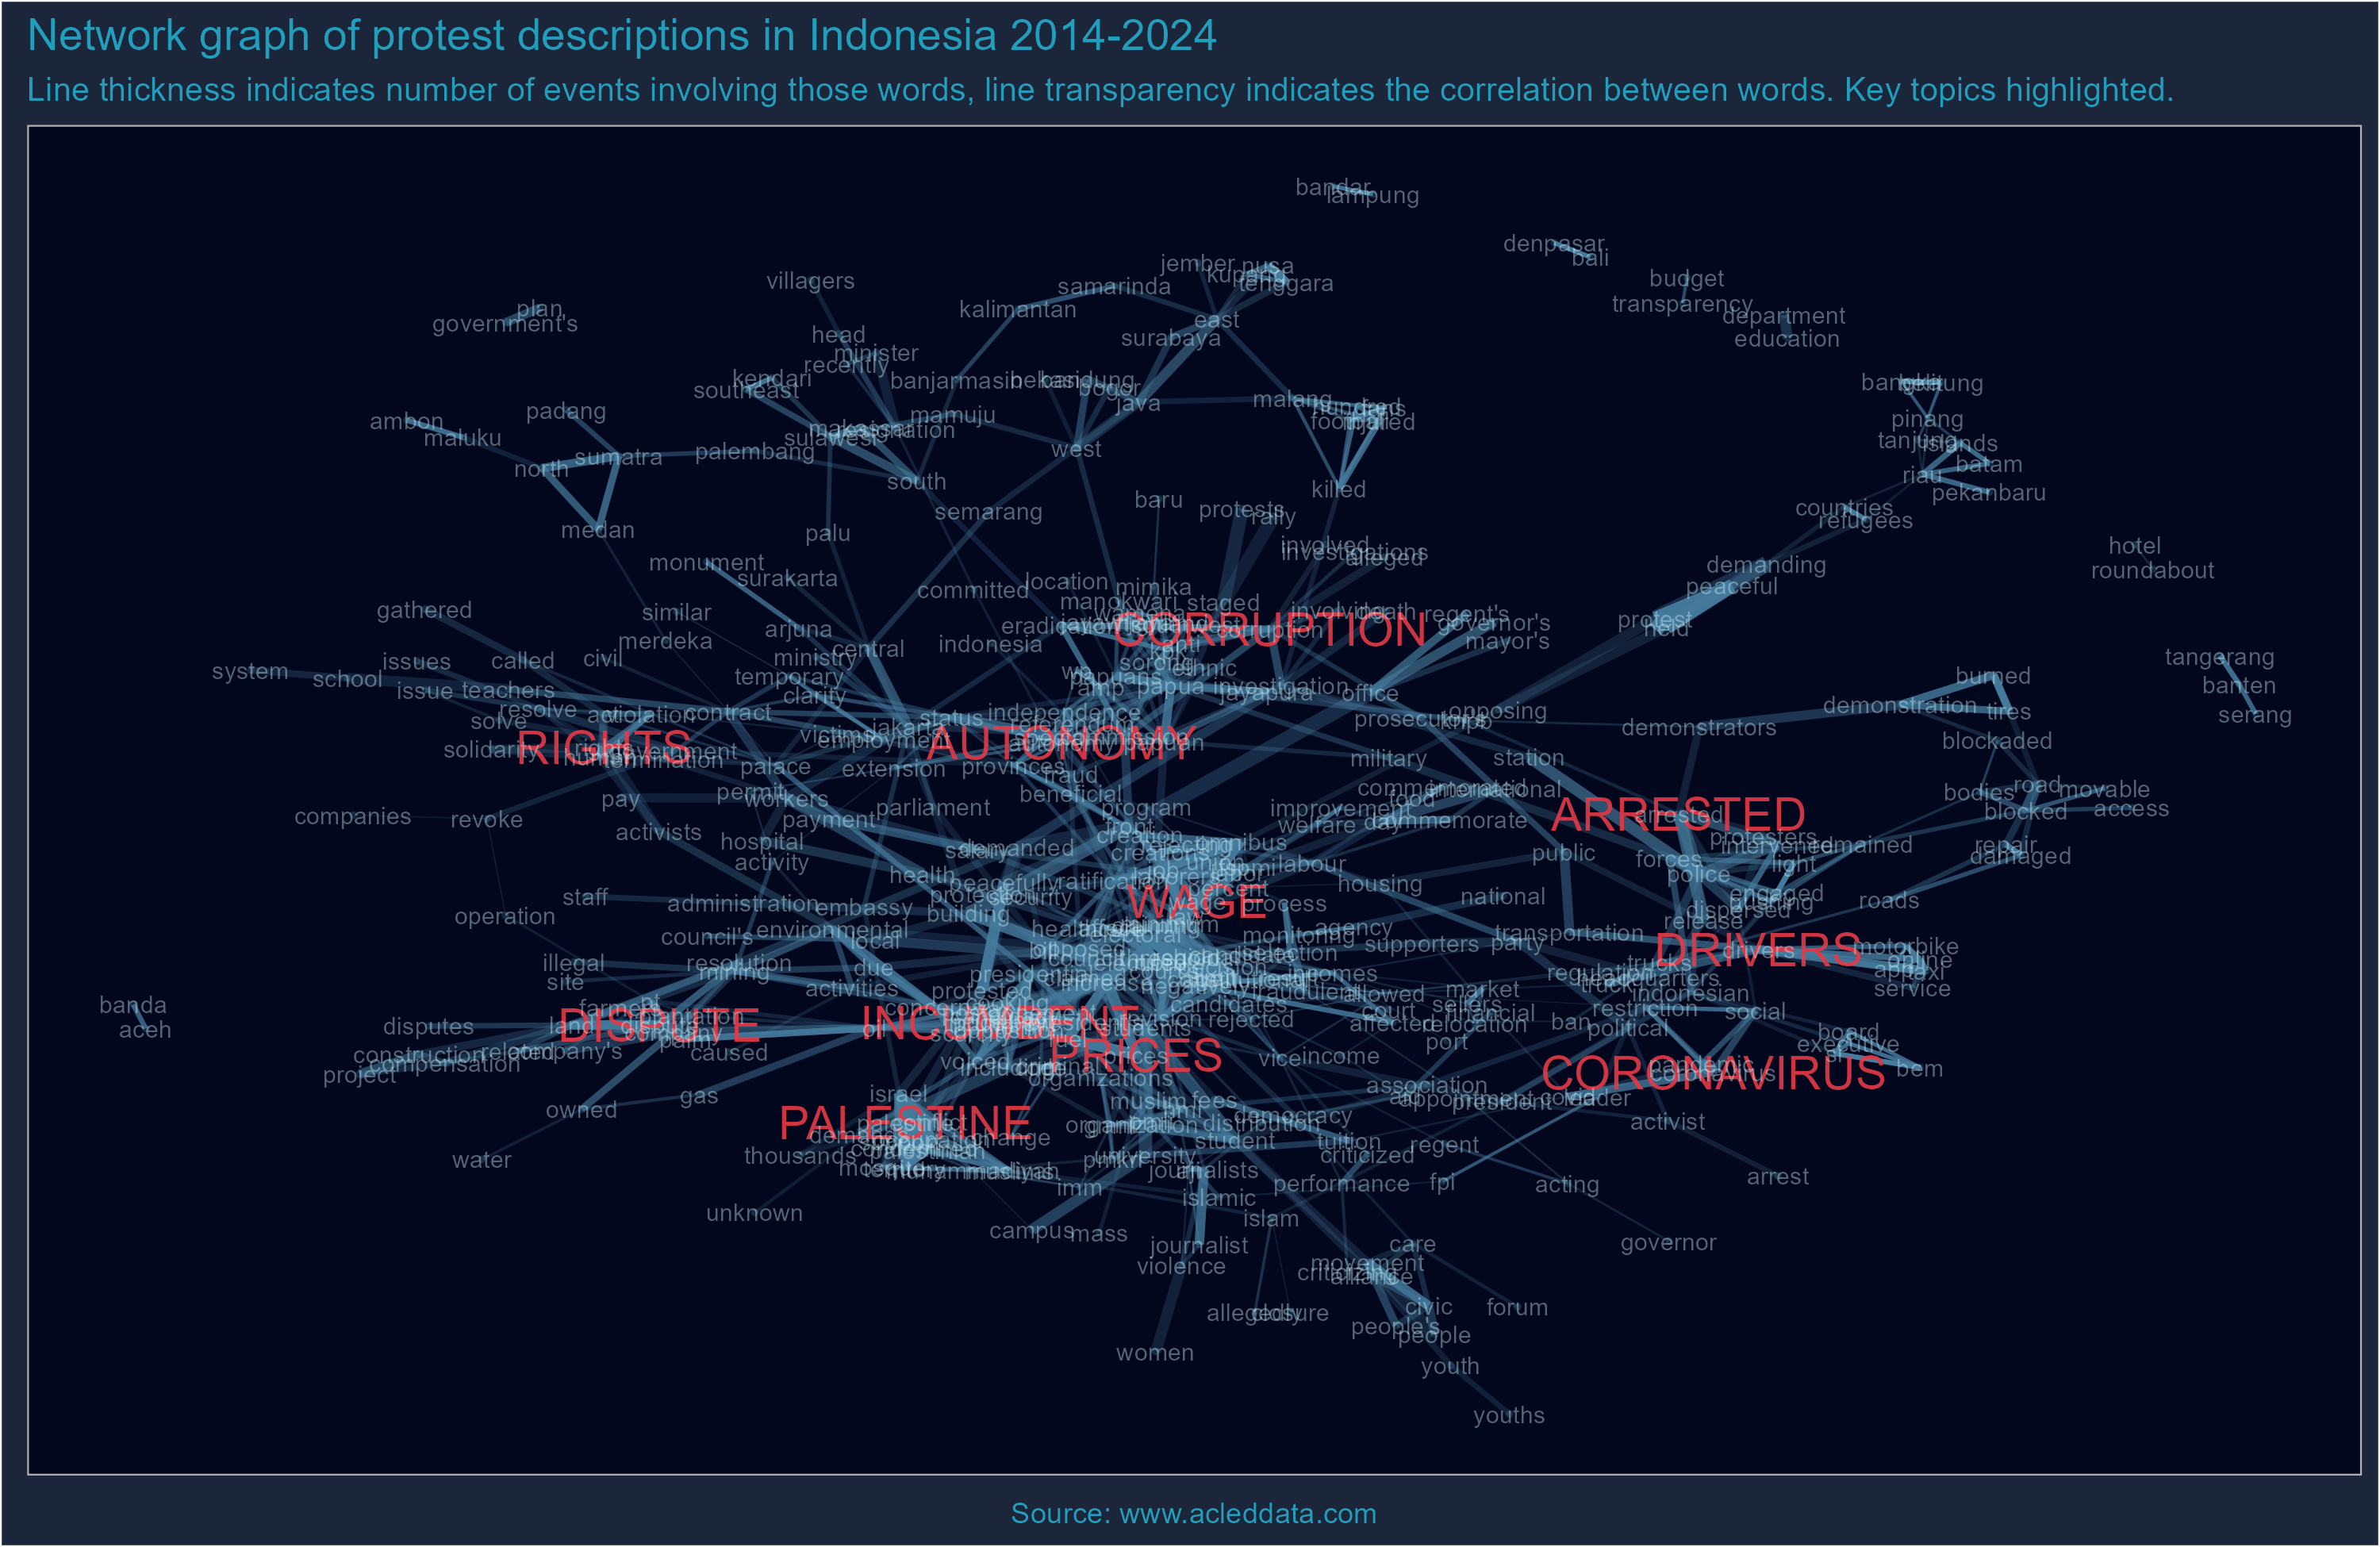
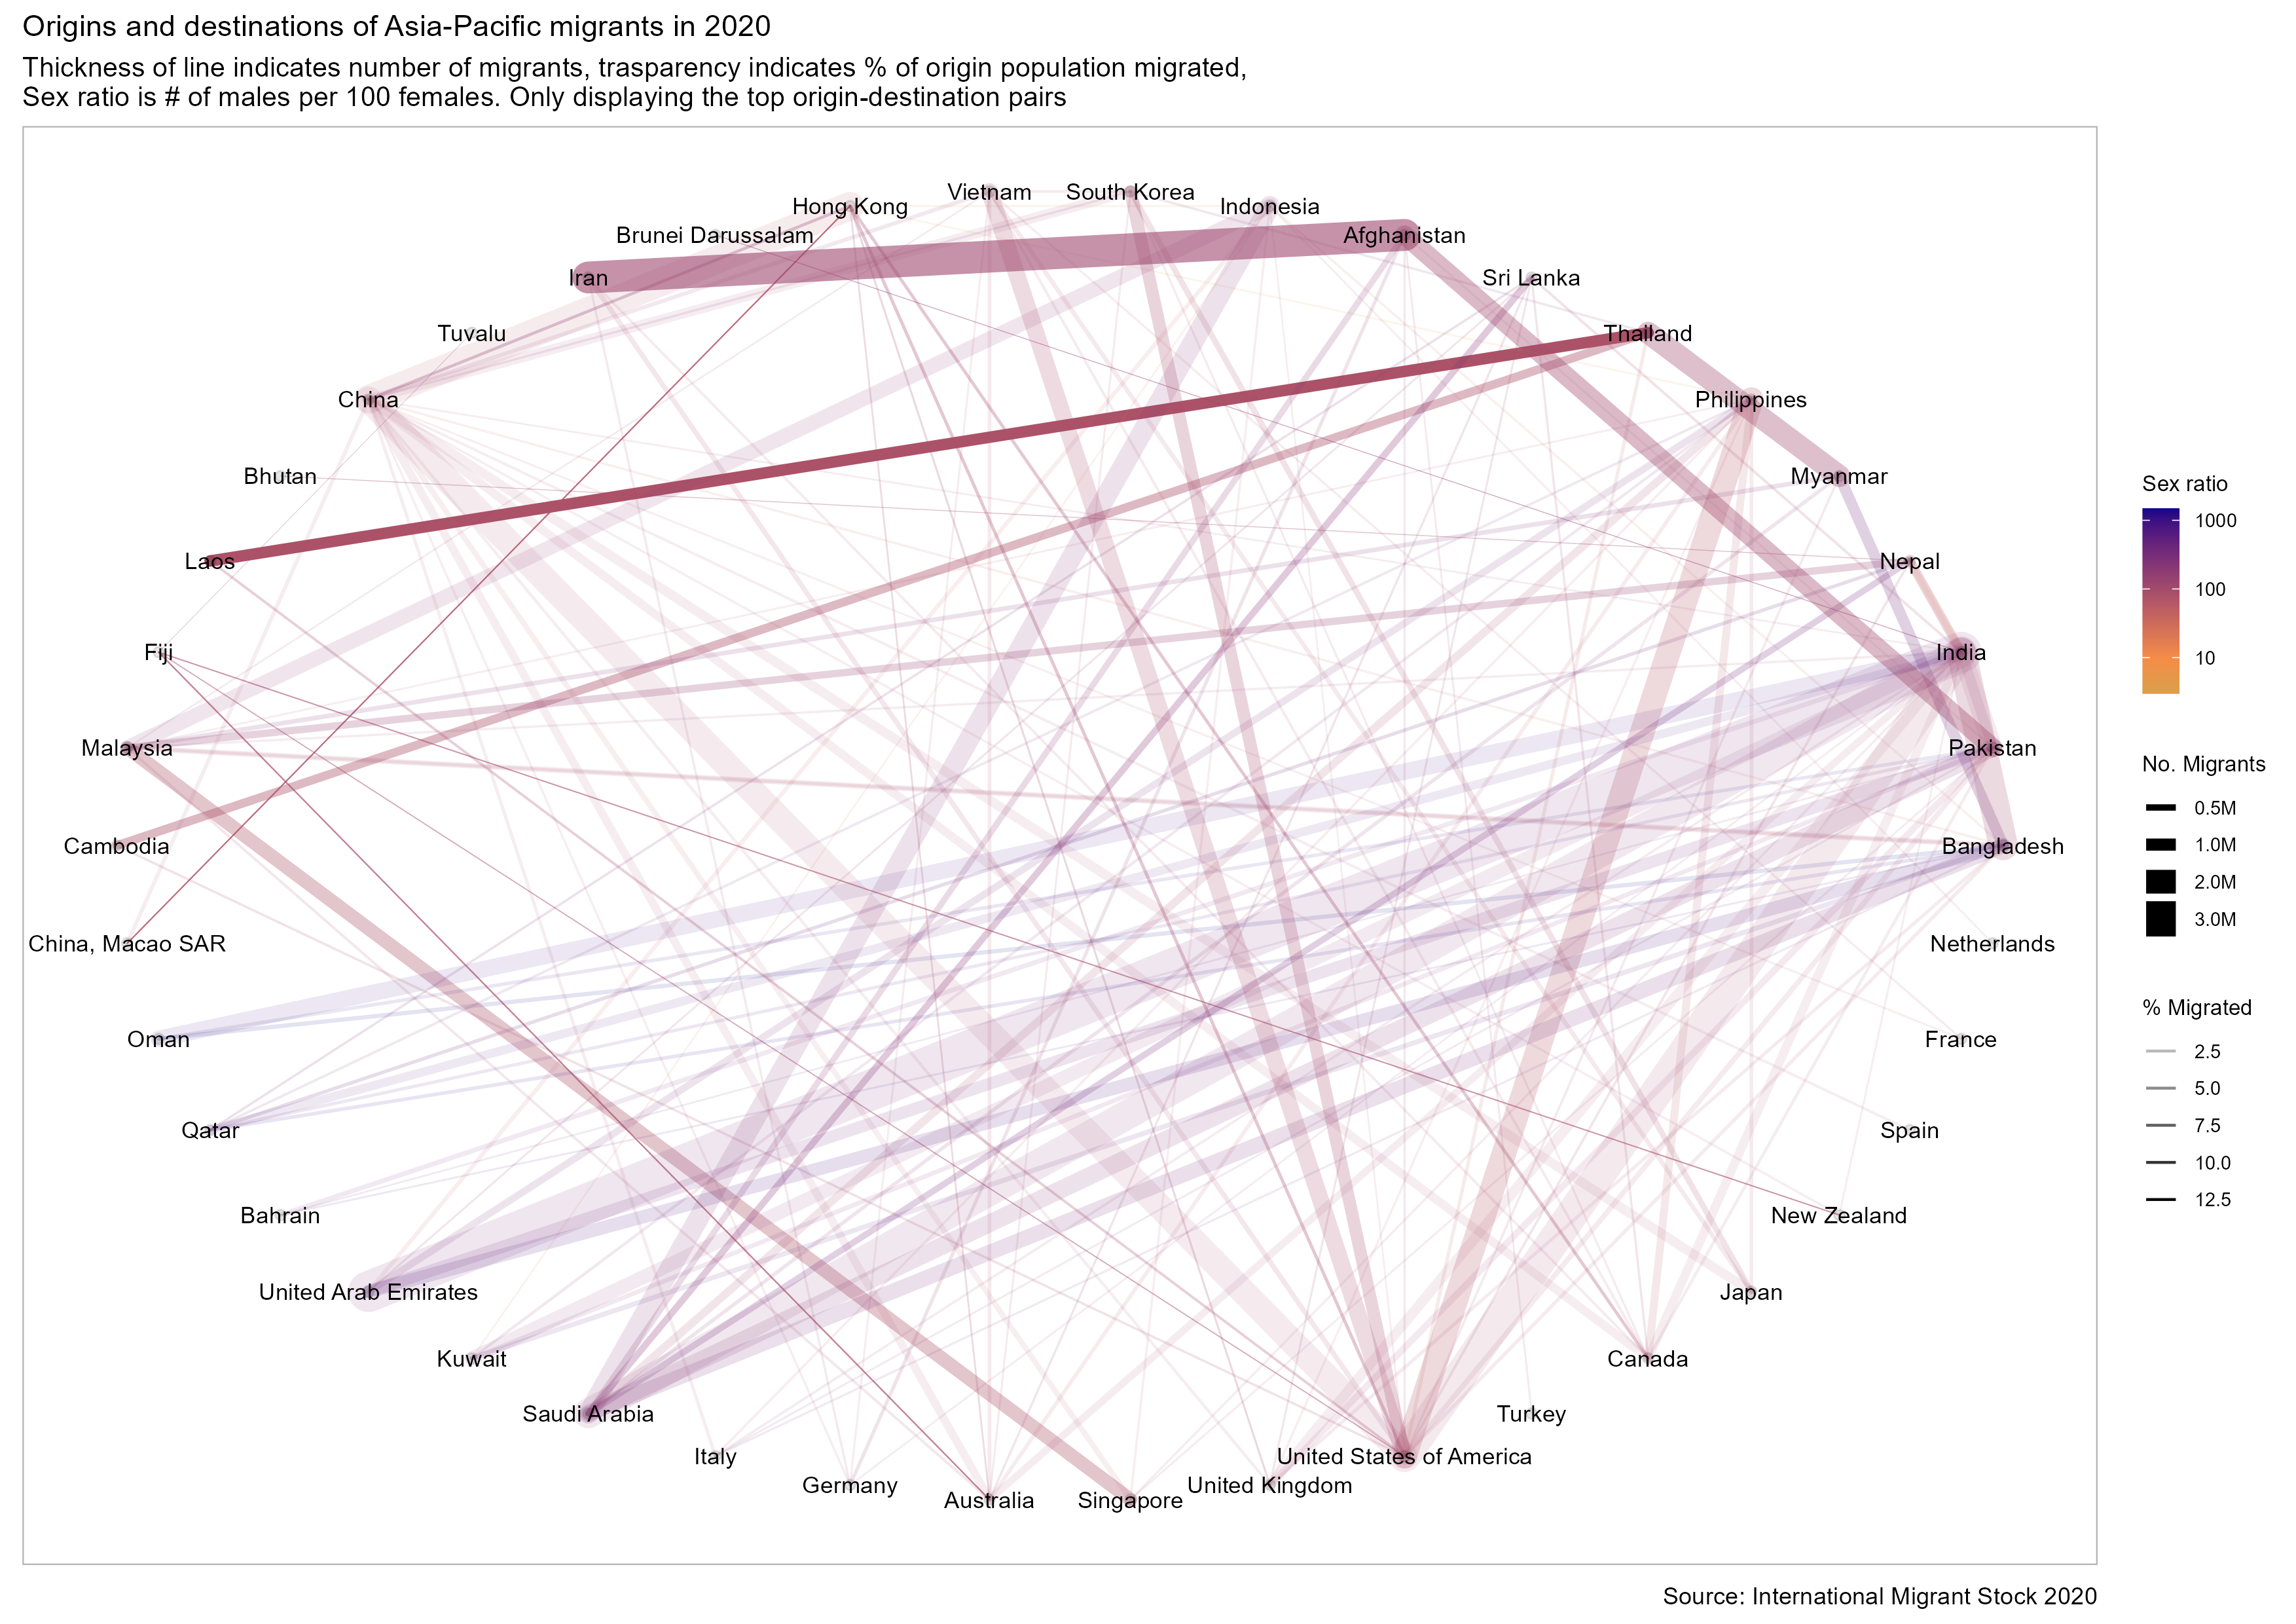
Strategic insight
What are your customers and employees saying about you? Hopefully better things than Indonesians are saying about their government in this network graph of protest topics. Let us review and analyse your surveys and find out.
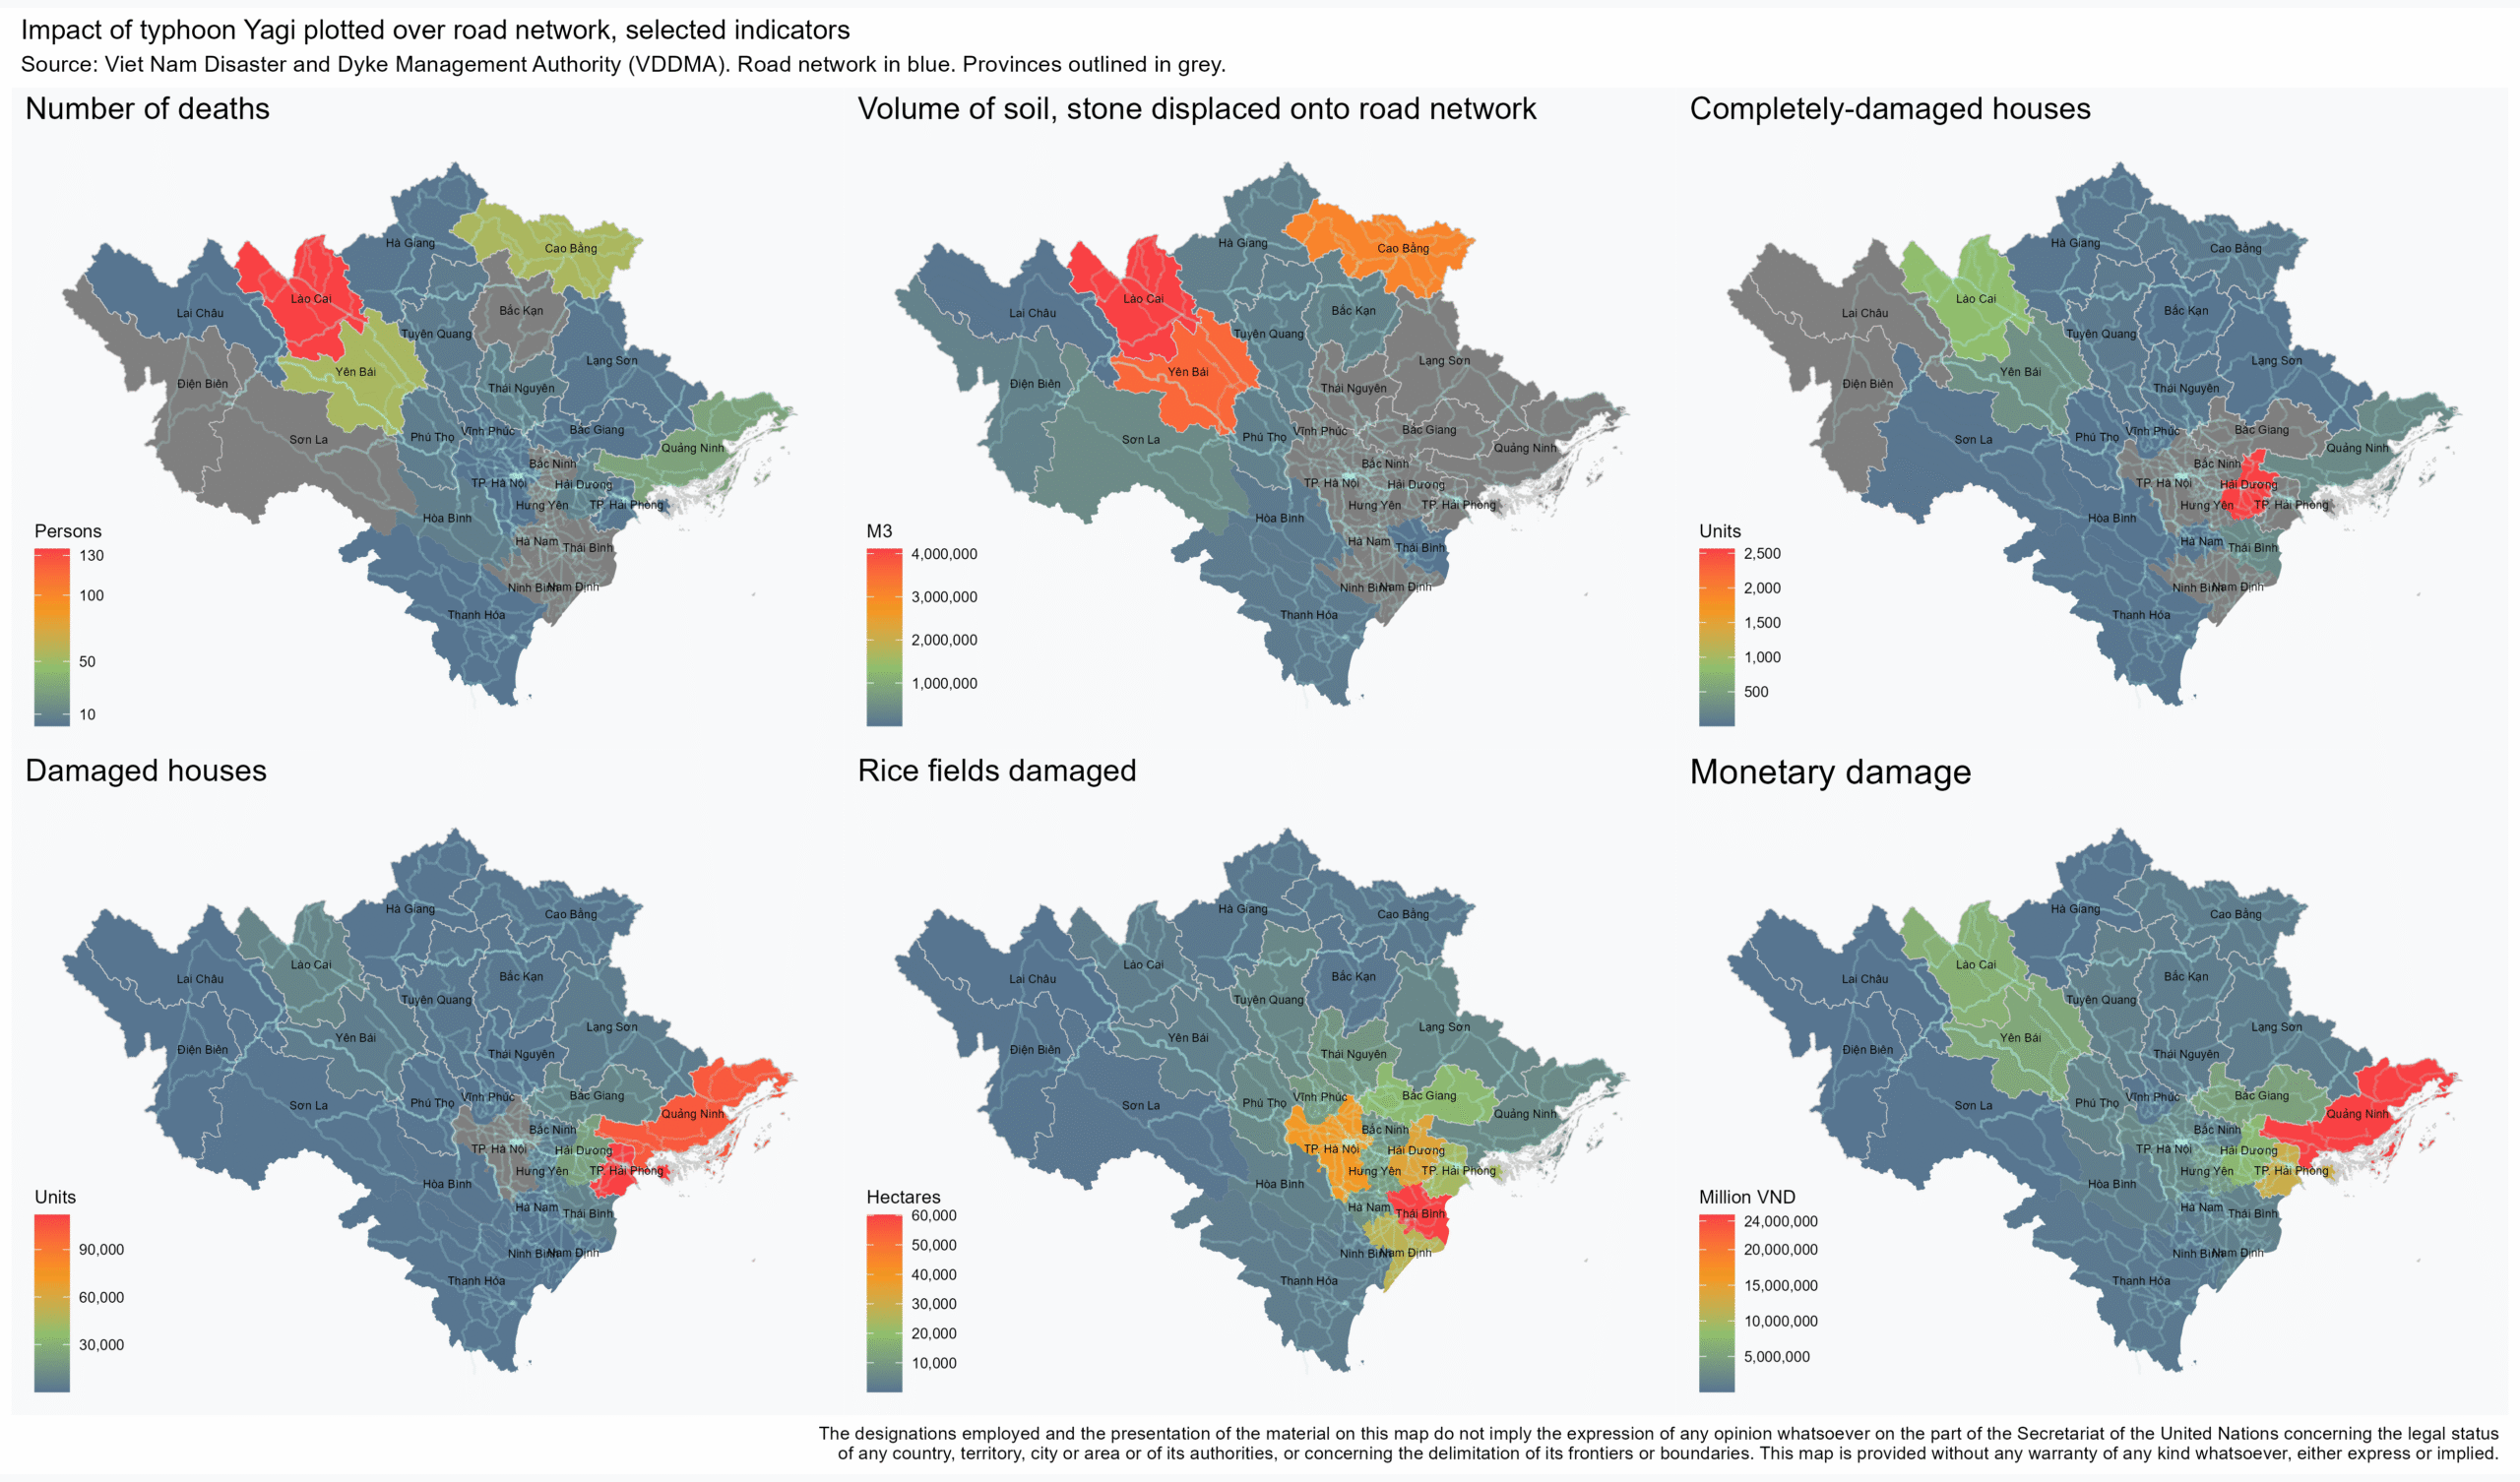
PUT YOUR data in context
With custom dashboards and visuals, explore all that your data has to offer.
Overlay your data with geographic data to make custom maps. Get those finishing touches on your reports or commission research on a specific geography or territory.
preserve detail and data quality
Collecting data costs time and money: make sure you’re making the best use of it.
The plot on the right shows municipal and parroquial breakdowns of the percentage of households without access to improved sanitation (flush toilets, connect to sewerage or pipe system etc.).
We note that intra-municipal variances are greater than variances across the entire state. Additionally, too high of an aggregation level — municipal level in this case — results in the obscuring of the worst areas and a potential misallocation of resources.
UNDERSTAND risk and commit to Sustainable growth
Understand and address core issues in your work.
The scale and savings wrought by optimisation are a wonder. But one must ask: are we misdiagnosing the issue and just rearranging deck chairs on the titanic?
Why Choose Us
We’re experts in multidimensional problems and have handled data from almost every sector, including Health, Education, Food, Water and Sanitation, Construction, Finance and Logistics, in all types of contexts, all around the world, including complex emergencies. Do you need a consulting data analyst? Make AIMdata your trusted partner for all your data needs.
Optimisation not dehumanisation
There is a fine line between systematisation and bureaucratisation. This is not to say that all black box models are bad — human consciousness is also a black box. But now more so than ever, we must recognise the old age: all models are wrong, but some are useful.
custom-made
solutions
Do you need research? Or need analysis on a new market or dataset? Let us perform an exploratory analysis of your data and build custom solutions based on what we find. No AI workslop here. But we will also write you custom reports in code that you can get AI to alter for you.
PREFERENCE for
open-source software
Open-source and free options exist for many products. SMEs should do their best to not be tied down to enterprise systems, especially those that demand subscriptions. Most code is written in R, which is open-source and free. We would be very pleased to train your staff in R.
Our Projects
Visualisation and exploratory analysis helps make sense of data. When we overlay conflict locations with the road network in Myanmar, we observe the main front, in Sagaing; how linear the conflict is; and that should Mandalay fall to rebel forces, there would be no other major garrison before the capital.
What are you waiting for?
Ready to take the next step? Let’s bring your vision to life! Explore our services and get in touch today for a consultation. Together, we’ll make it happen.
Our work in numbers
projects
+20
PEOPLE REACHED
+3M
years of experience
+13
countries
+15
How we’ve spent our time
DAtA VISUALISATION AND ANALYSIS
38%
STRATEGY AND ACTIONABLE INTELLIGENCE
18%
REPORtiNG AND DATA QUALITY
18%
QUALITY
ASSURANCE
17%
TRAINING AND CAPACITY
BUILDING
9%
Explore Our Blog

Contact us
Do you need a world-class Data Analyst and consultant?